
Last Updated on 2021-10-14 by Clay
在使用 Flutter 開發 APP 的過程中,若是有繪製圖表的需求,那麼可以推薦一個強大的繪製圖表套件:fl_chart。
根據 Flutter pub 上的資訊所示(https://pub.dev/packages/fl_chart),fl_chart 能夠繪製的圖表大致上可以分為以下數種:
- 折線圖(line chart)
- 長條圖(bar chart)
- 圓餅圖(pie chart)
- 散點圖(scatter chart)
甚至未來預計新增支援『雷達圖』(radar chart)的繪製功能,真的是功能非常齊全的套件。
不過,今天最重要的是,由於我個人專案的需求,我需要使用 fl_chart 來繪製圓餅圖。其中官方的說明、以及一些簡單的個人理解、範例程式碼一併記錄於下方。
Fl_chart 繪製圓餅圖的 PieChart 可調整參數
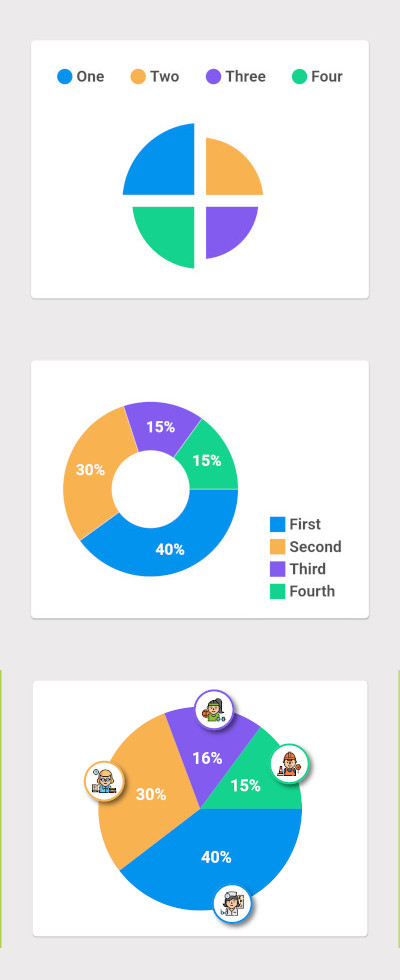
從 Github 上的圖示中可以看出,fl_chart 不僅單純提供了繪製圓餅圖的接口,甚至提供了非常多種客製化圓餅圖的方法。
而其中我們可以控制的數個參數,我引用 Github 上的說明,一同紀錄如下。若有相關方面需求的朋友,同樣建議先瀏覽過這些參數一遍,讓等下閱讀程式碼的部分能更有概念。
PieChartData
這是圓餅圖資料的基本參數。
| PropName | Description | default value |
|---|---|---|
| sections | 顯示圓餅圖 PieChartSectionData 的列表(PieChartSectionData 的參數於下方記述) | [] |
| centerSpaceRadius | 圓餅圖 PieChart 中心的可使用空間。(若要隨可視大小調整,須設定 double.infinity) | double.nan |
| centerSpaceColor | 圓餅圖 PieChart 中心可使用空間的顏色 | Colors.transparent |
| sectionsSpace | sections 之間的間隔 | 2 |
| startDegreeOffset | 圓餅圖旋轉的偏移量(0-360) | 0 |
| pieTouchData | 使用 PieTouchData 類別控制『觸控互動』(PieTouchData 的參數於下方記述) | PieTouchData() |
| borderData | 使用 FlBorderData 控制圖表的邊框資訊(FlBorderData 的參數於下方記述) | FlBorderData() |
PieChartSectionData
PieChartSectionData 是圖餅圖中的 section(也就是一塊扇形區域)的類別。
我們可以透過設定 PieChartSectionData 去客製化每個扇形區域。
| PropName | Description | default value |
|---|---|---|
| value | value 是每個 section 的權重。(越大的權重會讓一個圓餅圖的扇形所佔面積越大) | 10 |
| color | section 的顏色 | Colors.red |
| radius | section 的寬度半徑 | 40 |
| showTitle | 顯示或隱藏每個 section 的標題 | true |
| titleStyle | 設定 TextStyle | TextStyle( color: Colors.white, fontSize: 16, fontWeight: FontWeight.bold ) |
| title | section 的標題 | value |
| badgeWidget | section 的徽章元件(設置圖片) | null |
| titlePositionPercentageOffset | section 的標題位置(應介於 0-1 之間) | 0.5 |
| badgePositionPercentageOffset | section 的徽章位置(應介於 0-1 之間) | 0.5 |
PieTouchData
| PropName | Description | default value |
|---|---|---|
| enable | 啟用或禁用觸控行為 | true |
| touchCallback | 監聽 callback(回調)以此檢索觸控事件。會提供 PieTouchResponse(PieTouchResponse 的參數於下方記述) | null |
PieTouchResponse
| PropName | Description | default value |
|---|---|---|
| sectionData | 使用者觸碰的 PieChartSectionData | null |
| touchedSectionIndex | 使用者觸碰的 section 編號 | null |
| touchAngle | 使用者觸碰的角度 | null |
| touchRadius | 使用者觸碰的半徑 | null |
| touchInput | 一個使用 FlTouchInput 類別封裝的觸控行為(本篇文章不會使用,有興趣可前往 FlTouchInput 查看) | null |
FlBorderData
| PropName | Description | default value |
|---|---|---|
| show | 顯示或隱藏邊框 | true |
| border | 使用 Border 類別設定描繪邊框的詳細資訊 | Border.all(color: Colors.black, width: 1.0, style: BorderStyle.bold ) |
準備工作
首先,自然得讓專案擁有此套件。在專案的 pubspec.yaml 中寫下:
dependencies:
  flutter:
    sdk: flutter
  fl_chart: ^0.12.3
之後再使用以下指令取得套件。
flutter pub get
順帶一提,0.12.3 是我所使用的版本,若是有跟 Flutter 版本不匹配的狀況,需要前往 Flutter pub 上的 fl_chart 套件頁面,詳細確認何種版本匹配自己的 Flutter 版本。
範例程式碼解釋
匯入套件、撰寫 main() 進入點
import 'package:flutter/material.dart';
import 'package:flutter/services.dart';

import 'package:fl_chart/fl_chart.dart';


// Main
void main() => runApp(MyApp());


class MyApp extends StatelessWidget {
  @override
  Widget build(BuildContext context) {
    return MaterialApp(
      home: PieChartPage(),
    );
  }
}


class PieChartPage extends StatefulWidget {
  @override
  State<StatefulWidget> createState() => _PieChartPageState();
}
之後,主要的程式碼則由 _PieChartPageState() 開始。不過在那之前,依照官方範例程式碼,我們可以撰寫 Indicator 類別來製作圓餅圖的小圖示說明。
Indicator
// Indicator
class Indicator extends StatelessWidget {
  final Color color;
  final Color textColor;
  final String text;
  final bool isSquare;
  final double size;

  const Indicator({
    Key key,
    this.color,
    this.textColor = Colors.white,
    this.text,
    this.isSquare,
    this.size = 16,
  }) : super(key: key);

  @override
  Widget build(BuildContext context) {
    return Row(
      children: <Widget>[
        Container(
          width: size,
          height: size,
          decoration: BoxDecoration(
            shape: isSquare ? BoxShape.rectangle : BoxShape.circle,
            color: color,
          ),
        ),
        const SizedBox(
          width: 3,
        ),
        Text(
          text,
          style: TextStyle(
            fontSize: 16,
            fontWeight: FontWeight.bold,
            color: textColor,
          ),
        )
      ],
    );
  }
}
呈現的效果大致上如下:

_PieChartPageState()
class _PieChartPageState extends State {
  int touchedIndex;

  @override
  Widget build(BuildContext context) {
    SystemChrome.setEnabledSystemUIOverlays([SystemUiOverlay.bottom]);
    return AspectRatio(
      aspectRatio: 1.3,
      child: Card(
        color: Colors.white,
        child: Column(
          children: <Widget>[
            const SizedBox(
              height: 28,
            ),
            Row(
              mainAxisSize: MainAxisSize.max,
              mainAxisAlignment: MainAxisAlignment.spaceEvenly,
              children: <Widget>[
                Indicator(
                  color: Colors.blue,
                  text: "One",
                  isSquare: false,
                  size: touchedIndex == 0 ? 18 : 16,
                  textColor: touchedIndex == 0
                    ? Colors.black
                    : Colors.grey,
                ),
                Indicator(
                  color: Colors.red,
                  text: "Two",
                  isSquare: false,
                  size: touchedIndex == 1 ? 18 : 16,
                  textColor: touchedIndex == 1
                    ? Colors.black
                    : Colors.grey,
                ),
                Indicator(
                  color: Colors.green,
                  text: "Three",
                  isSquare: false,
                  size: touchedIndex == 2 ? 18 : 16,
                  textColor: touchedIndex == 2
                    ? Colors.black
                    : Colors.grey,
                ),
                Indicator(
                  color: Colors.yellow,
                  text: "Four",
                  isSquare: false,
                  size: touchedIndex == 3 ? 18 : 16,
                  textColor: touchedIndex == 3
                    ? Colors.black
                    : Colors.grey,
                ),
              ],
            ),
            const SizedBox(
              height: 18,
            ),

            // Pie chart
            Expanded(
              child: AspectRatio(
                aspectRatio: 1,
                child: PieChart(
                  PieChartData(
                    pieTouchData: PieTouchData(touchCallback: (pieTouchResponse) {
                      setState(() {
                        if (pieTouchResponse.touchInput is FlLongPressEnd ||
                            pieTouchResponse.touchInput is FlPanEnd) {
                          touchedIndex = -1;
                        }
                        else {
                          touchedIndex = pieTouchResponse.touchedSectionIndex;
                        }
                      });
                    }),
                    startDegreeOffset: 270,
                    borderData: FlBorderData(
                      show: false,
                    ),
                    sectionsSpace: 1,
                    centerSpaceRadius: 0,
                    sections: showingSections()
                  ),
                ),
              )
            )
          ],
        ),
      ),
    );
  }

  List<PieChartSectionData> showingSections() {
    return List.generate(
      4,
      (index) {
        final isTouched = index == touchedIndex;
        final double opacity = isTouched ? 1 : 0.6;

        // Condition
        switch (index) {
          case 0:
            return PieChartSectionData(
              color: Colors.blue.withOpacity(opacity),
              value: 1,
              title: "blue pie",
              radius: 80,
              titleStyle: TextStyle(
                fontSize: 18,
                fontWeight: FontWeight.bold,
                color: Colors.black,
              ),
              titlePositionPercentageOffset: 0.99,
            );
          case 1:
            return PieChartSectionData(
              color: Colors.red.withOpacity(opacity),
              value: 1,
              title: "red pie",
              radius: 65,
              titleStyle: TextStyle(
                fontSize: 18,
                fontWeight: FontWeight.bold,
                color: Colors.black
              ),
              titlePositionPercentageOffset: 0.99,
            );
          case 2:
            return PieChartSectionData(
              color: Colors.green.withOpacity(opacity),
              value: 1,
              title: "green pie",
              radius: 60,
              titleStyle: TextStyle(
                fontSize: 18,
                fontWeight: FontWeight.bold,
                color: Colors.black
              ),
              titlePositionPercentageOffset: 0.99,
            );
          case 3:
            return PieChartSectionData(
              color: Colors.yellow.withOpacity(opacity),
              value: 1,
              title: "yellow pie",
              radius: 100,
              titleStyle: TextStyle(
                fontSize: 18,
                fontWeight: FontWeight.bold,
                color: Colors.black
              ),
              titlePositionPercentageOffset: 0.99,
            );
          default:
            return null;
        }
      }
    );
  }
}
大致上分成兩個部分:
- 小圖示說明
- 圓餅圖的 section 設定(包含使用者觸碰時 section 不再透明)
可試跑的完整範例程式碼紀錄如下。
完整範例程式碼
import 'package:flutter/material.dart';
import 'package:flutter/services.dart';

import 'package:fl_chart/fl_chart.dart';


// Main
void main() => runApp(MyApp());


// Indicator
class Indicator extends StatelessWidget {
  final Color color;
  final Color textColor;
  final String text;
  final bool isSquare;
  final double size;

  const Indicator({
    Key key,
    this.color,
    this.textColor = Colors.white,
    this.text,
    this.isSquare,
    this.size = 16,
  }) : super(key: key);

  @override
  Widget build(BuildContext context) {
    return Row(
      children: <Widget>[
        Container(
          width: size,
          height: size,
          decoration: BoxDecoration(
            shape: isSquare ? BoxShape.rectangle : BoxShape.circle,
            color: color,
          ),
        ),
        const SizedBox(
          width: 3,
        ),
        Text(
          text,
          style: TextStyle(
            fontSize: 16,
            fontWeight: FontWeight.bold,
            color: textColor,
          ),
        )
      ],
    );
  }
}


class MyApp extends StatelessWidget {
  @override
  Widget build(BuildContext context) {
    return MaterialApp(
      home: PieChartPage(),
    );
  }
}


class PieChartPage extends StatefulWidget {
  @override
  State<StatefulWidget> createState() => _PieChartPageState();
}


class _PieChartPageState extends State {
  int touchedIndex;

  @override
  Widget build(BuildContext context) {
    SystemChrome.setEnabledSystemUIOverlays([SystemUiOverlay.bottom]);
    return AspectRatio(
      aspectRatio: 1.3,
      child: Card(
        color: Colors.white,
        child: Column(
          children: <Widget>[
            const SizedBox(
              height: 28,
            ),
            Row(
              mainAxisSize: MainAxisSize.max,
              mainAxisAlignment: MainAxisAlignment.spaceEvenly,
              children: <Widget>[
                Indicator(
                  color: Colors.blue,
                  text: "One",
                  isSquare: false,
                  size: touchedIndex == 0 ? 18 : 16,
                  textColor: touchedIndex == 0
                    ? Colors.black
                    : Colors.grey,
                ),
                Indicator(
                  color: Colors.red,
                  text: "Two",
                  isSquare: false,
                  size: touchedIndex == 1 ? 18 : 16,
                  textColor: touchedIndex == 1
                    ? Colors.black
                    : Colors.grey,
                ),
                Indicator(
                  color: Colors.green,
                  text: "Three",
                  isSquare: false,
                  size: touchedIndex == 2 ? 18 : 16,
                  textColor: touchedIndex == 2
                    ? Colors.black
                    : Colors.grey,
                ),
                Indicator(
                  color: Colors.yellow,
                  text: "Four",
                  isSquare: false,
                  size: touchedIndex == 3 ? 18 : 16,
                  textColor: touchedIndex == 3
                    ? Colors.black
                    : Colors.grey,
                ),
              ],
            ),
            const SizedBox(
              height: 18,
            ),

            // Pie chart
            Expanded(
              child: AspectRatio(
                aspectRatio: 1,
                child: PieChart(
                  PieChartData(
                    pieTouchData: PieTouchData(touchCallback: (pieTouchResponse) {
                      setState(() {
                        if (pieTouchResponse.touchInput is FlLongPressEnd ||
                            pieTouchResponse.touchInput is FlPanEnd) {
                          touchedIndex = -1;
                        }
                        else {
                          touchedIndex = pieTouchResponse.touchedSectionIndex;
                        }
                      });
                    }),
                    startDegreeOffset: 270,
                    borderData: FlBorderData(
                      show: false,
                    ),
                    sectionsSpace: 1,
                    centerSpaceRadius: 0,
                    sections: showingSections()
                  ),
                ),
              )
            )
          ],
        ),
      ),
    );
  }

  List<PieChartSectionData> showingSections() {
    return List.generate(
      4,
      (index) {
        final isTouched = index == touchedIndex;
        final double opacity = isTouched ? 1 : 0.6;

        // Condition
        switch (index) {
          case 0:
            return PieChartSectionData(
              color: Colors.blue.withOpacity(opacity),
              value: 1,
              title: "blue pie",
              radius: 80,
              titleStyle: TextStyle(
                fontSize: 18,
                fontWeight: FontWeight.bold,
                color: Colors.black,
              ),
              titlePositionPercentageOffset: 0.99,
            );
          case 1:
            return PieChartSectionData(
              color: Colors.red.withOpacity(opacity),
              value: 1,
              title: "red pie",
              radius: 65,
              titleStyle: TextStyle(
                fontSize: 18,
                fontWeight: FontWeight.bold,
                color: Colors.black
              ),
              titlePositionPercentageOffset: 0.99,
            );
          case 2:
            return PieChartSectionData(
              color: Colors.green.withOpacity(opacity),
              value: 1,
              title: "green pie",
              radius: 60,
              titleStyle: TextStyle(
                fontSize: 18,
                fontWeight: FontWeight.bold,
                color: Colors.black
              ),
              titlePositionPercentageOffset: 0.99,
            );
          case 3:
            return PieChartSectionData(
              color: Colors.yellow.withOpacity(opacity),
              value: 1,
              title: "yellow pie",
              radius: 100,
              titleStyle: TextStyle(
                fontSize: 18,
                fontWeight: FontWeight.bold,
                color: Colors.black
              ),
              titlePositionPercentageOffset: 0.99,
            );
          default:
            return null;
        }
      }
    );
  }
}
Output:
References
- https://pub.dev/packages/fl_chart
- https://github.com/imaNNeoFighT/fl_chart
- https://codewithflutter.blogspot.com/2019/08/a-library-to-draw-fantastic-charts-in.html