
Last Updated on 2021-10-14 by Clay
If you have a requirement for plotting a pie chart when you developing via Flutter, I can recommend a useful plotting package: fl_chart.
According to the information on Flutter pub (https://pub.dev/packages/fl_chart), there are several types of charts that fl_chart can plot:
- Line chart
- Bar chart
- Pie chart
- Scatter chart
It is even expected to add support for radar chart. It is really a very full-featured package.
However, the most important thing is that I need to use fl_chart to draw a pie chart. The official description, some simple personal description, and sample code are recorded below.
Introduction to the PieChart parameter of fl_chart
As can be seen from the diagram on GitHub, fl_chart not only provides an interface for drawing pie charts, but also provides many ways to customize pie charts.
I quote the instructions on GitHub for introducing the parameters.
PieChartData
This is the basic parameter of PieChartData.
| PropName | Description | default value |
|---|---|---|
| sections | Display the list of PieChartSectionData (the parameters of PieChartSectionData are described below) | [] |
| centerSpaceRadius | The available space in the center of the PieChart. (If you want to adjust with the visual size, you must set double.infinity) | double.nan |
| centerSpaceColor | Pie Chart The color of the usable space in the center of the PieChart | Colors.transparent |
| sectionsSpace | Interval between sections | 2 |
| startDegreeOffset | Offset of pie chart rotation (0-360) | 0 |
| pieTouchData | Use PieTouchData class to control “touch interaction” (PieTouchData parameters are described below) | PieTouchData() |
| borderData | Use FlBorderData to control the border information of the chart (the parameters of FlBorderData are described below) | FlBorderData() |
PieChartSectionData
PieChartSectionData is a section class of pie chart. We can configure PieChartSectionData to customize any section area.
| PropName | Description | default value |
|---|---|---|
| value | value is the weight of each section. (The greater the weight, the larger the area occupied by the sector of a pie chart) | 10 |
| color | section color | Colors.red |
| radius | section radius width | 40 |
| showTitle | Show or hide the title of each section | true |
| titleStyle | title style | TextStyle( color: Colors.white, fontSize: 16, fontWeight: FontWeight.bold ) |
| title | section title | value |
| badgeWidget | section badge | null |
| titlePositionPercentageOffset | section title percentage (0 – 1) | 0.5 |
| badgePositionPercentageOffset | section badge percentage (0 – 1) | 0.5 |
PieTouchData
| PropName | Description | default value |
|---|---|---|
| enable | Enable or disable touch behavior | true |
| touchCallback | Listen to the callback to retrieve touch events. PieTouchResponse will be provided (the parameters of PieTouchResponse are described below) | null |
PieTouchResponse
| PropName | Description | default value |
|---|---|---|
| sectionData | PieChartSectionData touched by the user | null |
| touchedSectionIndex | The section number touched by the user | null |
| touchAngle | The angle touched by the user | null |
| touchRadius | The radius the user touches | null |
| touchInput | A touch behavior encapsulated in the FlTouchInput class (this article will not use it, you can go to FlTouchInput to view if you are interested) | null |
FlBorderData
| PropName | Description | default value |
|---|---|---|
| show | Show or hide the border | true |
| border | Use the Border class to set the details of the drawing border | Border.all(color: Colors.black, width: 1.0, style: BorderStyle.bold ) |
Preparation
First we need to get the fl_chart package. Write in the project’s pubspec.yaml:
dependencies:
  flutter:
    sdk: flutter
  fl_chart: ^0.12.3
Then use the following command to get package:
flutter pub get
By the way, 0.12.3 is the version I used, if your version is mismatch with Flutter version, you need to go to the fl_chart package page to confirm which version is correct.
Sampel Code Explanation
Import package and build main() entry point
import 'package:flutter/material.dart';
import 'package:flutter/services.dart';

import 'package:fl_chart/fl_chart.dart';


// Main
void main() => runApp(MyApp());


class MyApp extends StatelessWidget {
  @override
  Widget build(BuildContext context) {
    return MaterialApp(
      home: PieChartPage(),
    );
  }
}


class PieChartPage extends StatefulWidget {
  @override
  State<StatefulWidget> createState() => _PieChartPageState();
}
After that, the main program starts with _PieChartPageState(). But before that, according to the official sample code, we can write the Indicator class to create a small icon description of the pie chart.
Indicator
// Indicator
class Indicator extends StatelessWidget {
  final Color color;
  final Color textColor;
  final String text;
  final bool isSquare;
  final double size;

  const Indicator({
    Key key,
    this.color,
    this.textColor = Colors.white,
    this.text,
    this.isSquare,
    this.size = 16,
  }) : super(key: key);

  @override
  Widget build(BuildContext context) {
    return Row(
      children: <Widget>[
        Container(
          width: size,
          height: size,
          decoration: BoxDecoration(
            shape: isSquare ? BoxShape.rectangle : BoxShape.circle,
            color: color,
          ),
        ),
        const SizedBox(
          width: 3,
        ),
        Text(
          text,
          style: TextStyle(
            fontSize: 16,
            fontWeight: FontWeight.bold,
            color: textColor,
          ),
        )
      ],
    );
  }
}
The effect is roughly as follows:

_PieChartPageState()
class _PieChartPageState extends State {
  int touchedIndex;

  @override
  Widget build(BuildContext context) {
    SystemChrome.setEnabledSystemUIOverlays([SystemUiOverlay.bottom]);
    return AspectRatio(
      aspectRatio: 1.3,
      child: Card(
        color: Colors.white,
        child: Column(
          children: <Widget>[
            const SizedBox(
              height: 28,
            ),
            Row(
              mainAxisSize: MainAxisSize.max,
              mainAxisAlignment: MainAxisAlignment.spaceEvenly,
              children: <Widget>[
                Indicator(
                  color: Colors.blue,
                  text: "One",
                  isSquare: false,
                  size: touchedIndex == 0 ? 18 : 16,
                  textColor: touchedIndex == 0
                    ? Colors.black
                    : Colors.grey,
                ),
                Indicator(
                  color: Colors.red,
                  text: "Two",
                  isSquare: false,
                  size: touchedIndex == 1 ? 18 : 16,
                  textColor: touchedIndex == 1
                    ? Colors.black
                    : Colors.grey,
                ),
                Indicator(
                  color: Colors.green,
                  text: "Three",
                  isSquare: false,
                  size: touchedIndex == 2 ? 18 : 16,
                  textColor: touchedIndex == 2
                    ? Colors.black
                    : Colors.grey,
                ),
                Indicator(
                  color: Colors.yellow,
                  text: "Four",
                  isSquare: false,
                  size: touchedIndex == 3 ? 18 : 16,
                  textColor: touchedIndex == 3
                    ? Colors.black
                    : Colors.grey,
                ),
              ],
            ),
            const SizedBox(
              height: 18,
            ),

            // Pie chart
            Expanded(
              child: AspectRatio(
                aspectRatio: 1,
                child: PieChart(
                  PieChartData(
                    pieTouchData: PieTouchData(touchCallback: (pieTouchResponse) {
                      setState(() {
                        if (pieTouchResponse.touchInput is FlLongPressEnd ||
                            pieTouchResponse.touchInput is FlPanEnd) {
                          touchedIndex = -1;
                        }
                        else {
                          touchedIndex = pieTouchResponse.touchedSectionIndex;
                        }
                      });
                    }),
                    startDegreeOffset: 270,
                    borderData: FlBorderData(
                      show: false,
                    ),
                    sectionsSpace: 1,
                    centerSpaceRadius: 0,
                    sections: showingSections()
                  ),
                ),
              )
            )
          ],
        ),
      ),
    );
  }

  List<PieChartSectionData> showingSections() {
    return List.generate(
      4,
      (index) {
        final isTouched = index == touchedIndex;
        final double opacity = isTouched ? 1 : 0.6;

        // Condition
        switch (index) {
          case 0:
            return PieChartSectionData(
              color: Colors.blue.withOpacity(opacity),
              value: 1,
              title: "blue pie",
              radius: 80,
              titleStyle: TextStyle(
                fontSize: 18,
                fontWeight: FontWeight.bold,
                color: Colors.black,
              ),
              titlePositionPercentageOffset: 0.99,
            );
          case 1:
            return PieChartSectionData(
              color: Colors.red.withOpacity(opacity),
              value: 1,
              title: "red pie",
              radius: 65,
              titleStyle: TextStyle(
                fontSize: 18,
                fontWeight: FontWeight.bold,
                color: Colors.black
              ),
              titlePositionPercentageOffset: 0.99,
            );
          case 2:
            return PieChartSectionData(
              color: Colors.green.withOpacity(opacity),
              value: 1,
              title: "green pie",
              radius: 60,
              titleStyle: TextStyle(
                fontSize: 18,
                fontWeight: FontWeight.bold,
                color: Colors.black
              ),
              titlePositionPercentageOffset: 0.99,
            );
          case 3:
            return PieChartSectionData(
              color: Colors.yellow.withOpacity(opacity),
              value: 1,
              title: "yellow pie",
              radius: 100,
              titleStyle: TextStyle(
                fontSize: 18,
                fontWeight: FontWeight.bold,
                color: Colors.black
              ),
              titlePositionPercentageOffset: 0.99,
            );
          default:
            return null;
        }
      }
    );
  }
}
It is roughly divided into two parts:
- The small icon description
- The section setting of the pie chart (including the section is no longer transparent when the user touches it)
The complete sample code is as follows.
Complete Code
import 'package:flutter/material.dart';
import 'package:flutter/services.dart';

import 'package:fl_chart/fl_chart.dart';


// Main
void main() => runApp(MyApp());


// Indicator
class Indicator extends StatelessWidget {
  final Color color;
  final Color textColor;
  final String text;
  final bool isSquare;
  final double size;

  const Indicator({
    Key key,
    this.color,
    this.textColor = Colors.white,
    this.text,
    this.isSquare,
    this.size = 16,
  }) : super(key: key);

  @override
  Widget build(BuildContext context) {
    return Row(
      children: <Widget>[
        Container(
          width: size,
          height: size,
          decoration: BoxDecoration(
            shape: isSquare ? BoxShape.rectangle : BoxShape.circle,
            color: color,
          ),
        ),
        const SizedBox(
          width: 3,
        ),
        Text(
          text,
          style: TextStyle(
            fontSize: 16,
            fontWeight: FontWeight.bold,
            color: textColor,
          ),
        )
      ],
    );
  }
}


class MyApp extends StatelessWidget {
  @override
  Widget build(BuildContext context) {
    return MaterialApp(
      home: PieChartPage(),
    );
  }
}


class PieChartPage extends StatefulWidget {
  @override
  State<StatefulWidget> createState() => _PieChartPageState();
}


class _PieChartPageState extends State {
  int touchedIndex;

  @override
  Widget build(BuildContext context) {
    SystemChrome.setEnabledSystemUIOverlays([SystemUiOverlay.bottom]);
    return AspectRatio(
      aspectRatio: 1.3,
      child: Card(
        color: Colors.white,
        child: Column(
          children: <Widget>[
            const SizedBox(
              height: 28,
            ),
            Row(
              mainAxisSize: MainAxisSize.max,
              mainAxisAlignment: MainAxisAlignment.spaceEvenly,
              children: <Widget>[
                Indicator(
                  color: Colors.blue,
                  text: "One",
                  isSquare: false,
                  size: touchedIndex == 0 ? 18 : 16,
                  textColor: touchedIndex == 0
                    ? Colors.black
                    : Colors.grey,
                ),
                Indicator(
                  color: Colors.red,
                  text: "Two",
                  isSquare: false,
                  size: touchedIndex == 1 ? 18 : 16,
                  textColor: touchedIndex == 1
                    ? Colors.black
                    : Colors.grey,
                ),
                Indicator(
                  color: Colors.green,
                  text: "Three",
                  isSquare: false,
                  size: touchedIndex == 2 ? 18 : 16,
                  textColor: touchedIndex == 2
                    ? Colors.black
                    : Colors.grey,
                ),
                Indicator(
                  color: Colors.yellow,
                  text: "Four",
                  isSquare: false,
                  size: touchedIndex == 3 ? 18 : 16,
                  textColor: touchedIndex == 3
                    ? Colors.black
                    : Colors.grey,
                ),
              ],
            ),
            const SizedBox(
              height: 18,
            ),

            // Pie chart
            Expanded(
              child: AspectRatio(
                aspectRatio: 1,
                child: PieChart(
                  PieChartData(
                    pieTouchData: PieTouchData(touchCallback: (pieTouchResponse) {
                      setState(() {
                        if (pieTouchResponse.touchInput is FlLongPressEnd ||
                            pieTouchResponse.touchInput is FlPanEnd) {
                          touchedIndex = -1;
                        }
                        else {
                          touchedIndex = pieTouchResponse.touchedSectionIndex;
                        }
                      });
                    }),
                    startDegreeOffset: 270,
                    borderData: FlBorderData(
                      show: false,
                    ),
                    sectionsSpace: 1,
                    centerSpaceRadius: 0,
                    sections: showingSections()
                  ),
                ),
              )
            )
          ],
        ),
      ),
    );
  }

  List<PieChartSectionData> showingSections() {
    return List.generate(
      4,
      (index) {
        final isTouched = index == touchedIndex;
        final double opacity = isTouched ? 1 : 0.6;

        // Condition
        switch (index) {
          case 0:
            return PieChartSectionData(
              color: Colors.blue.withOpacity(opacity),
              value: 1,
              title: "blue pie",
              radius: 80,
              titleStyle: TextStyle(
                fontSize: 18,
                fontWeight: FontWeight.bold,
                color: Colors.black,
              ),
              titlePositionPercentageOffset: 0.99,
            );
          case 1:
            return PieChartSectionData(
              color: Colors.red.withOpacity(opacity),
              value: 1,
              title: "red pie",
              radius: 65,
              titleStyle: TextStyle(
                fontSize: 18,
                fontWeight: FontWeight.bold,
                color: Colors.black
              ),
              titlePositionPercentageOffset: 0.99,
            );
          case 2:
            return PieChartSectionData(
              color: Colors.green.withOpacity(opacity),
              value: 1,
              title: "green pie",
              radius: 60,
              titleStyle: TextStyle(
                fontSize: 18,
                fontWeight: FontWeight.bold,
                color: Colors.black
              ),
              titlePositionPercentageOffset: 0.99,
            );
          case 3:
            return PieChartSectionData(
              color: Colors.yellow.withOpacity(opacity),
              value: 1,
              title: "yellow pie",
              radius: 100,
              titleStyle: TextStyle(
                fontSize: 18,
                fontWeight: FontWeight.bold,
                color: Colors.black
              ),
              titlePositionPercentageOffset: 0.99,
            );
          default:
            return null;
        }
      }
    );
  }
}
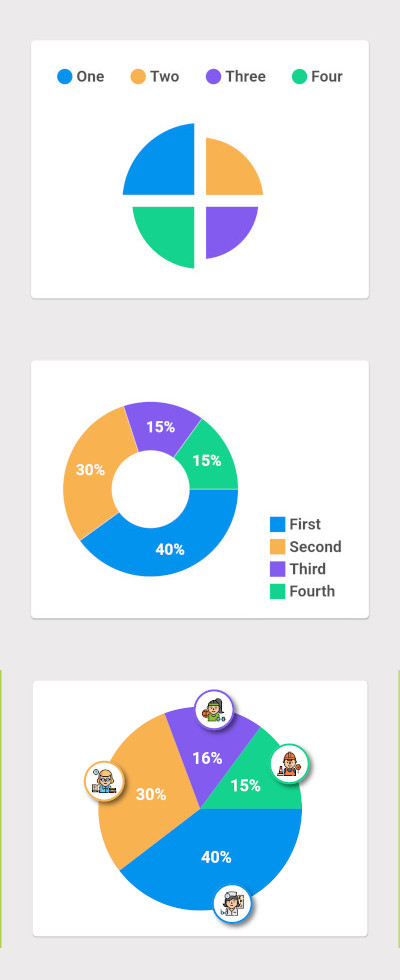
Output:
The above is a simple tutorial about how to use fl_chart for drawing a pie chart in Flutter.
References
- https://pub.dev/packages/fl_chart
- https://github.com/imaNNeoFighT/fl_chart
- https://codewithflutter.blogspot.com/2019/08/a-library-to-draw-fantastic-charts-in.html